
As we close the door on 2023 and look ahead to 2024, we can look back at what 2023 brought us and use that to help shape our strategies for the future. On the investment front, the S&P 500 performance, interest rates, inflation, and the fixed income markets are important to discuss to help inform how the TenBridge investment philosophy will proceed in the coming year.
One of the strongest mixed signals we’ve seen this year is in the performance of the S&P 500. Through the first 3 quarters of 2023, the S&P 500 was up 9.23%. That sounds like a very impressive year so far, however when you peel the onion back, the results become more nuanced. Out of the 500 companies that make up the S&P 500, 7 companies accounted for 97% of this positive return. The remaining 493 companies have not made any significant positive contribution to the return of the S&P 500. Our partners at Jensen Investment Management say this level of concentration is at levels not seen in 30 years and they don’t believe these trends will be sustainable.
We’re sure you’ve noticed goods and services are more expensive this year primarily because in 2022 inflation was 7.75%. The Federal Reserve has a goal to lower inflation to their target of 2% and as such, interest rates have spiked to over 7%. The days of home mortgages under 3% have ended.
The FED is using the central bank to raise interest rates to cause a slowdown in spending, but this is taking longer than they anticipated as consumers holding excess cash continued to spend. In 2023, the rates were raised three times. Inflation has now dropped to 3.2%. Until that 2% target is reached, the FED promises to keep rates at their current levels, or they may even increase them again to help reach the desired effect.
Home prices have continued to rise even with the increase in rates. The cost of construction is increasing, and homeowners are opting to stay in their homes that have low mortgage rates. Corporations are also impacted as they may spend less due to the increased cost of borrowing which could impact their earnings and have a negative impact on their stock prices.
The fixed income market has seen a major shift over the past year with the Fed rate increases. Over the prior 10 years, the overall fixed income market had an annual average return of less than 1% as rates wallowed at historically low levels. That trend is shifting, and 10-year treasury bond rates are currently over 4%. One-year rates have climbed to over 5%, which we call an inverted yield curve and is a negative indicator for future economic growth.
If the Fed can reach their inflation target, we would expect a slow decline in these rates. The Fed wouldn’t want to act too quickly and risk inflation spiking again, so it would appear rates will stay close to these levels for an extended period. Over the last decade, we’ve become used to historically low rates. But these levels are more in line with historical averages.
How does this impact our investment philosophy at TenBridge? We are continuing to focus on income from our investments, from dividends and increasingly so, from bond interest. We have adjusted our fixed income holdings favoring short duration holdings and a flexible bond mandate. The short duration fund allows us to take advantage of the current high rates with lower volatility. Flexible bond management provides an opportunity to move through fixed income sectors where there is opportunity. Prior to this change, we had some of our fixed income in long duration treasuries. This served us well when we first started investing in them, but long-term treasuries lost a lot of value when interest rates started to rise, and we lost the profits we had initially seen. By adding more flexibility, we are allowing the experienced fund managers to make these decisions within the fund.
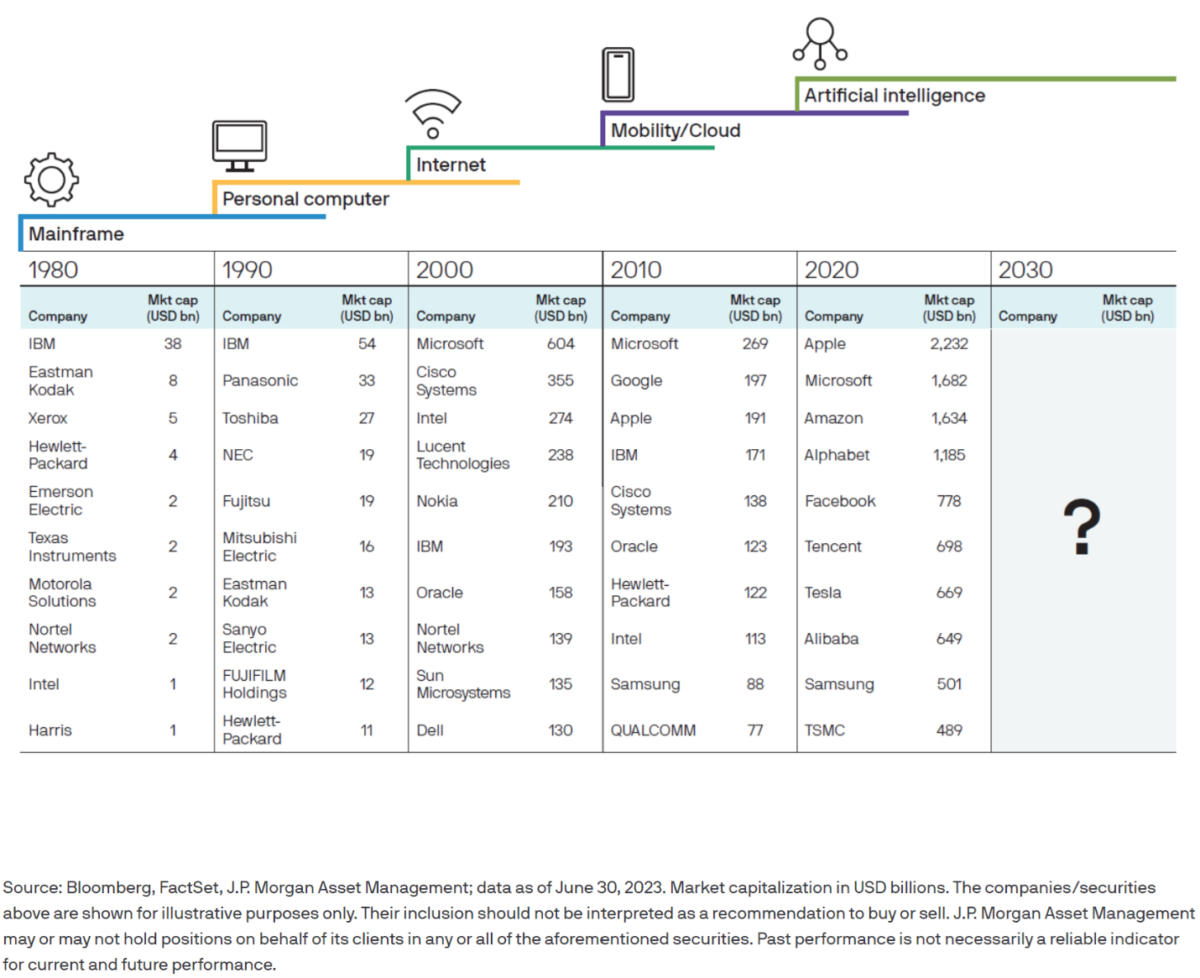
Regarding equities, we are remaining diversified and continuing to focus on high quality dividend paying companies. These are the types of companies that can weather most storms. We avoid trying to pick the next hot stock or investing in companies after they have seen major increases in value. In most cases, they are unable to sustain the momentum. Below is an interesting chart from J.P. Morgan that lists the top tech companies by market cap for each decade going back to 1980. In most cases, companies on the list in one decade tend to fall off the list in the next decade.
We are constantly reviewing our portfolios and putting ourselves to the test. At least once a quarter we gather as a team to analyze our portfolios and investment philosophy. We craft portfolios to compliment your financial plan and help you reach your goals.
We look forward to working with you in 2024 while continuing to provide you with confidence and clarity in an otherwise confusing world.
Scott Thurman
Operations Manager and Chief Compliance Officer
The information contained in this correspondence is intended for general educational purposes only and as a means for facilitating a conversation. Please consider our door always open to discuss your particular situation and how this information might benefit you and fit your specific needs.